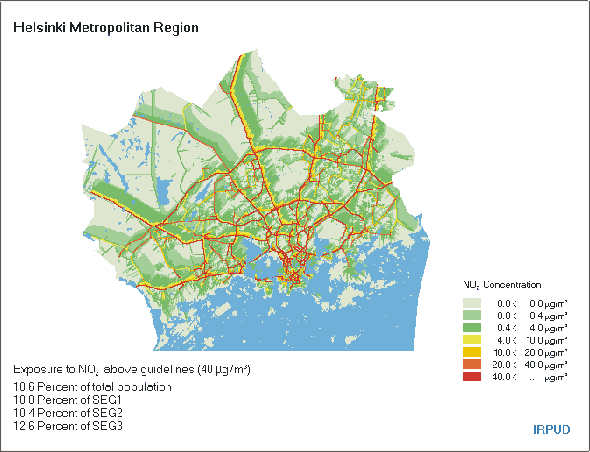
SPARTACUSTools: figure 5Published 15.1.2001 · Archive capture 14.8.2004 Tools Figure 5 Example of NO2 concentrations caused by traffic (yearly average) in the Helsinki region.